Data visualization for journals
Origin Reports
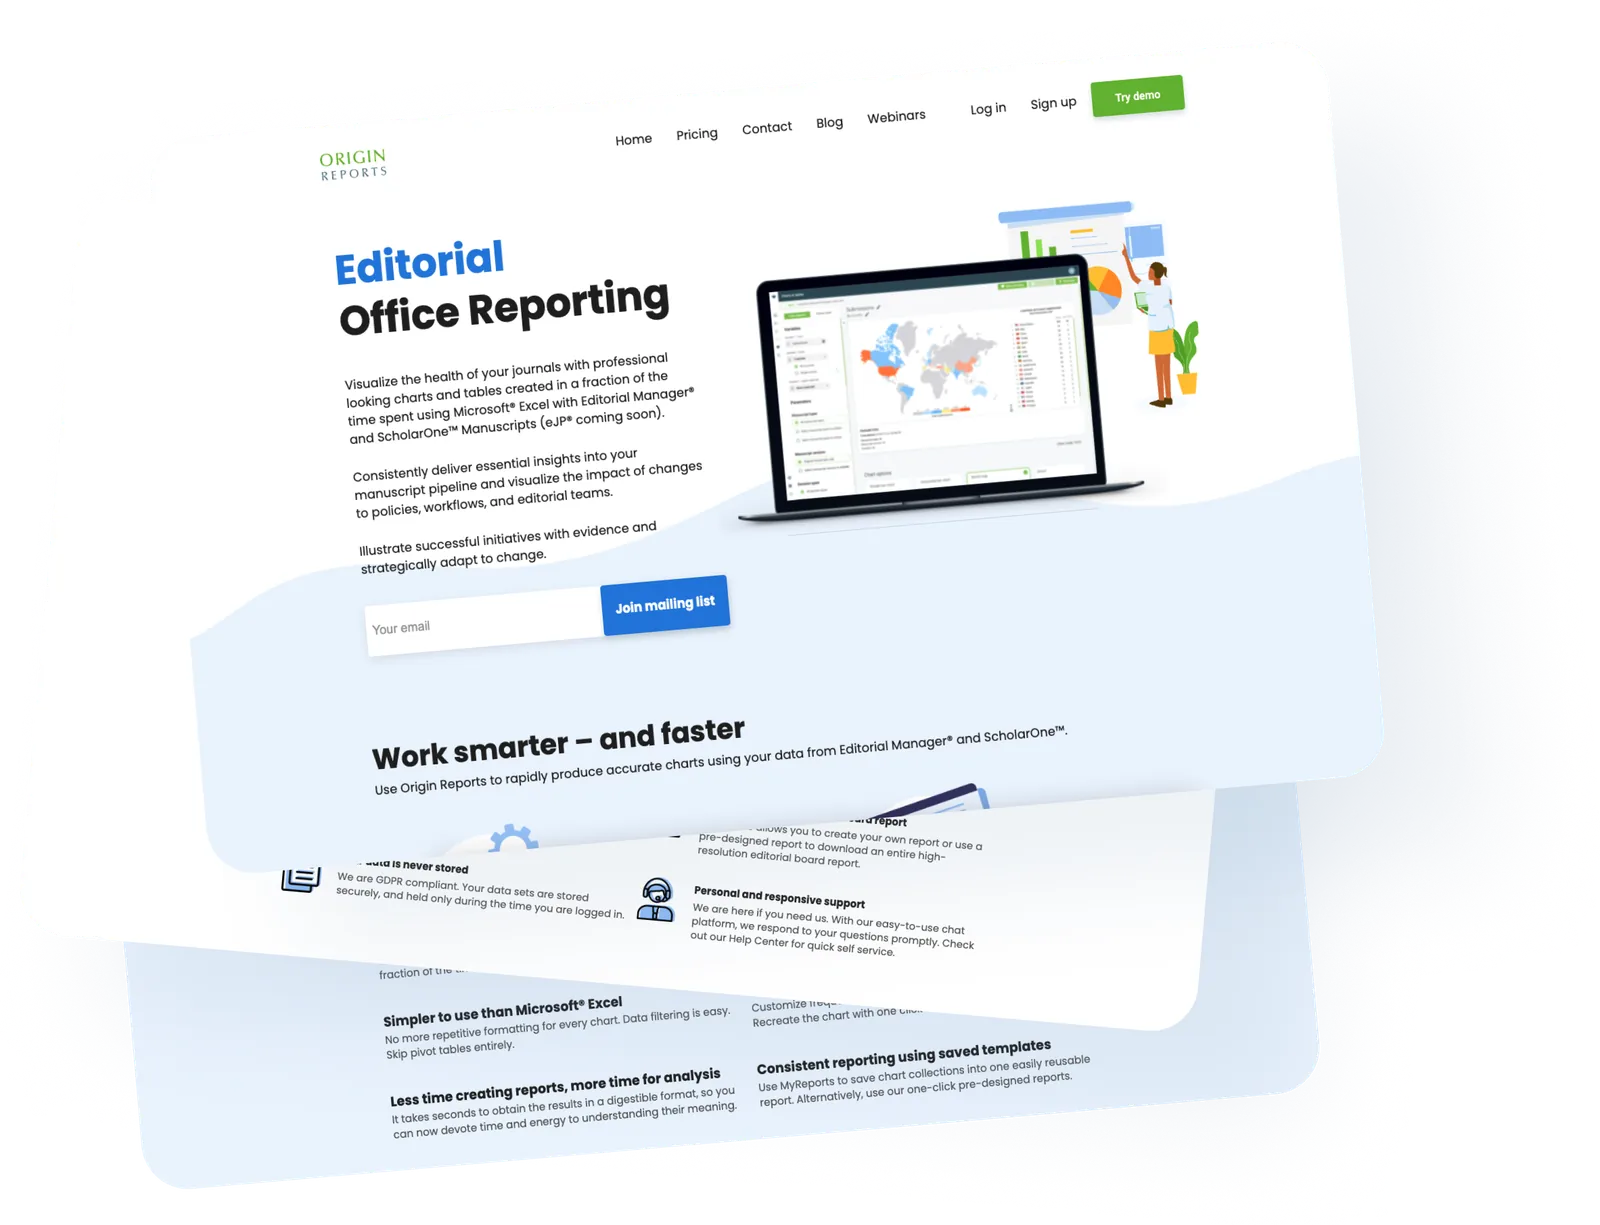
Origin Reports helps journal editorial offices see the health of their manuscript pipeline. Teams upload CSV exports from Editorial Manager or ScholarOne Manuscripts and get professional charts and tables in a fraction of the time spent in Excel.
Overview
We designed the product and built the flow from upload to finished report, along with its marketing site.
What we delivered
- CSV upload for large Editorial Manager and ScholarOne data sets
- Up to 200 generated visualizations per data set
- Saved report templates and pre-designed reports
- Marketing site

Design